SEO Analytics: Use these KPIs to measure the success of your SEO strategy
SEO Analytics: Use these KPIs to measure the success of your SEO strategy
SEO is (trust me) a resource-intensive process. It takes a lot of patience before the first results of your SEO measures become visible.
As SEO experts, however, we have found over the years that the difficulty of measuring SEO measures is often used as an excuse to shift responsibility to the ‘black box’ that is Google.
Although SEO initiatives are undoubtedly more difficult to measure than other marketing channels, this does not mean that you have to compromise. However, meaningful SEO reporting requires careful planning and implementation and should always be based on a sound strategy.
In this article, we'll show you which KPIs you should use to measure your SEO strategy and how you can display them in a clear dashboard.
What is SEO analytics?
SEO analytics refers to the analysis of data and metrics to gain insights into your website's organic performance in search engines. This typically includes monitoring keyword rankings, organic traffic, backlinks and technical metrics to evaluate the effectiveness of SEO measures and identify potential for improvement.
Which areas should be measured?
In order to measure the success of your SEO strategy and to implement optimisation measures in as targeted and resource-effective a manner as possible, it is important to define suitable SEO KPIs. As the saying goes: ‘If you can't measure it, you can't improve it.’
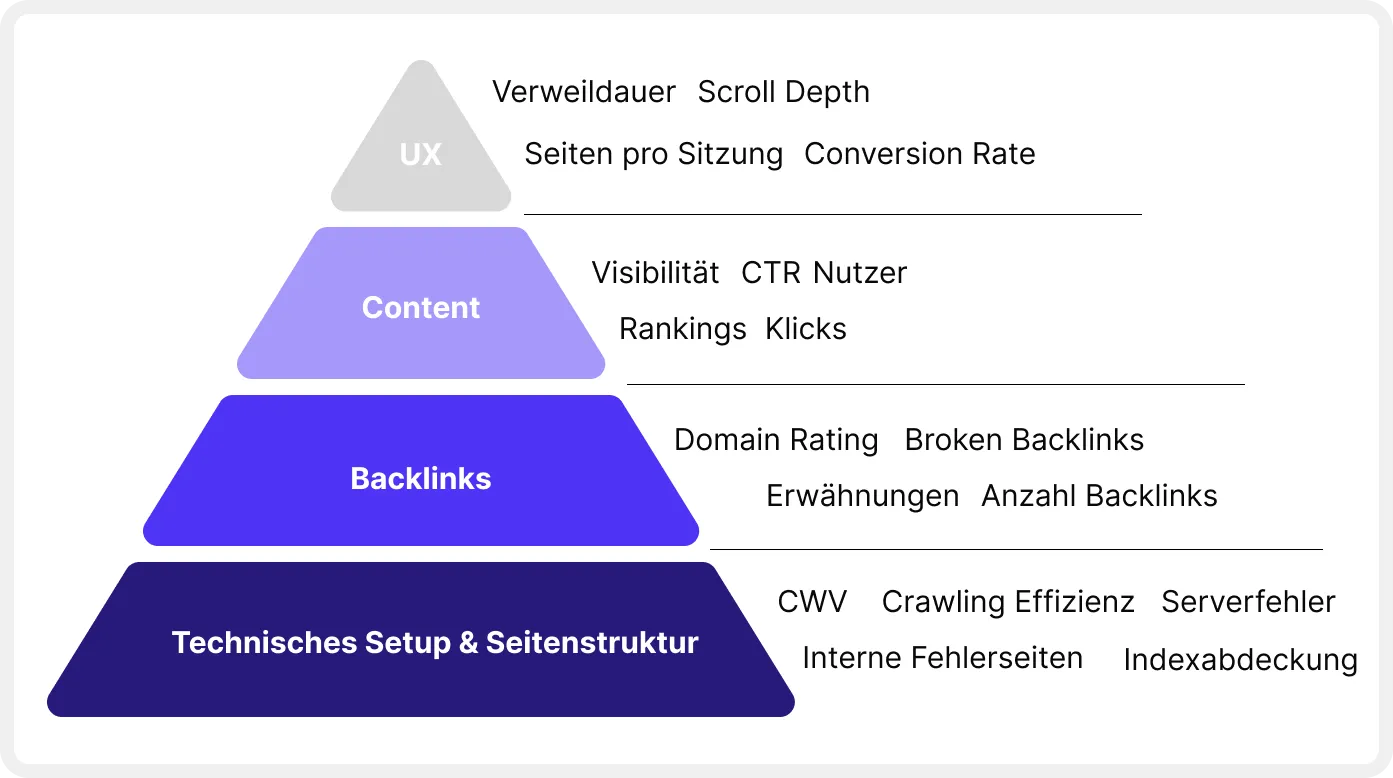
It is important to determine the KPIs based on your strategy and to keep an eye on all areas of SEO – technical SEO, backlinks, content SEO and UX. These areas are closely linked and influence each other. Only by defining KPIs in all areas can you get a comprehensive picture of your website's SEO performance and continuously optimise your SEO strategy.
Key SEO KPIs
Technical SEO KPIs
A solid technical setup is crucial for a successful SEO strategy. Even the best content is useless if search engines cannot crawl and index your website. Therefore, you should continuously monitor the technical setup of your website to ensure that it meets the most important requirements. We recommend that you focus on the following KPIs.
Page load time (Core Web Vitals)
Page load time has a significant impact on the user-friendliness of your website. In addition, a fast page also makes crawling easier for search engines, as fewer resources are required. For these reasons, page load time has been an official Google ranking factor since mid-2021 and is steadily gaining in importance.
Google uses the metrics LCP (Largest Contentful Paint), FID (First Input Delay) and CLS (Cumulative Layout Shift) as indicators of a fast and user-friendly page.
To ensure that your page is fast enough, you can use various tools to measure loading time and Core Web Vitals.
Core Web Vitals report in Google Search Console
The Core Web Vitals report from Google Search Console is a good first indicator for getting an overview of your website's page speed performance. Here you can see at a glance which URLs are already performing well and which ones you should optimise.
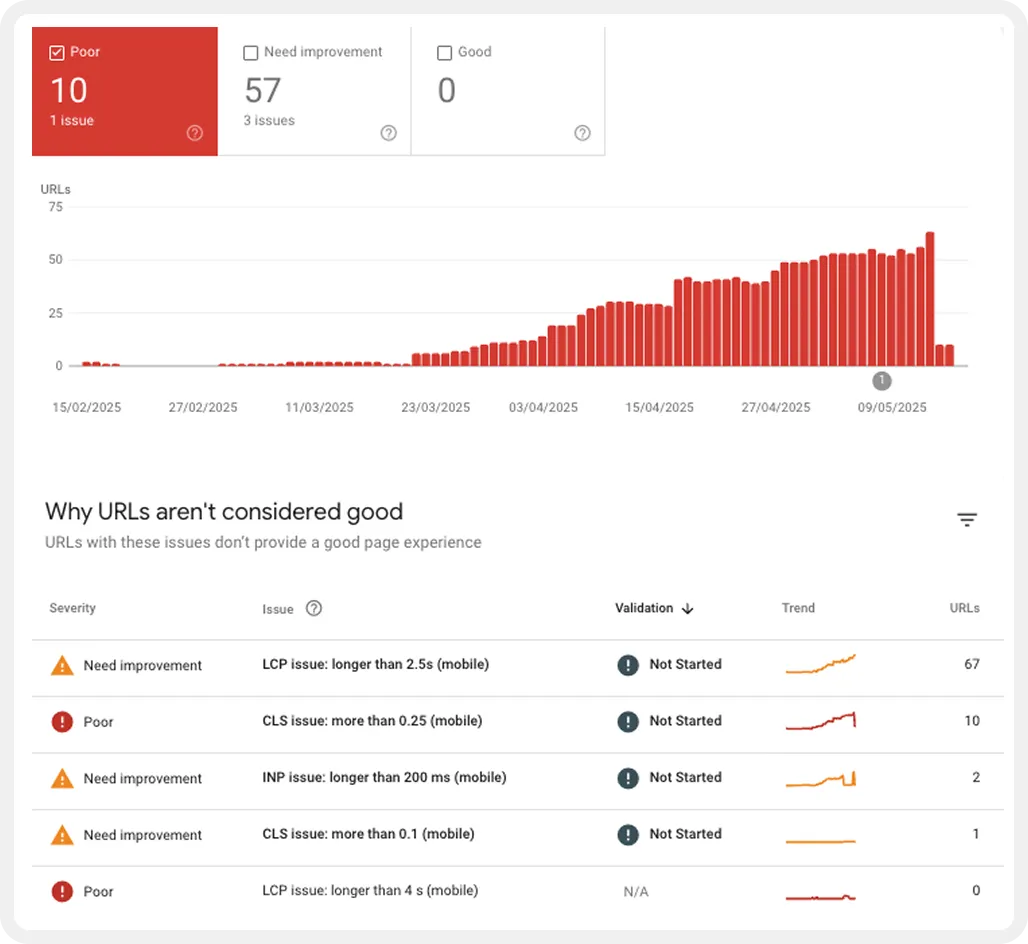
However, the report does not provide any information about possible reasons for slow-loading pages. In addition, only the performance of the last three months is displayed.
PageSpeed Insights API
If you want a more detailed report on your website's page performance, you can also integrate the data directly into a Looker Studio dashboard via the PageSpeed Insights API. This allows you to not only track overall performance in the three areas of LCP, FID and CLS, but also visualise detailed optimisation suggestions for individual URLs directly in your dashboard.
All you need to get started is a PageSpeed Insights API key, a licence for the Screamingfrog SEO Spider crawling tool, and a Google account to set up the dashboard in Looker Studio. You can find detailed instructions on how to do this in this guide from Screamingfrog.
[[callout]]
👉 If you need help with the setup, please feel free to contact us without obligation.
[[callout end]]
Page speed competitor monitoring
To find out how many resources you should invest in optimising your page load time, it can be helpful to create an overview of the load times of your closest competitors. Our experience has shown that it is primarily important that your page is as fast or faster than your competitors'.
If you are already well positioned compared to your competitors, we recommend that you focus on optimising other areas. However, if you see that there is room for improvement, it certainly makes sense to invest a little more resources in page speed optimisation.
A very simple and pragmatic way to keep an eye on your competition, which has proven itself in some of our customer projects, is to integrate the Chrome User Experience (CrUX) report into Looker Studio. This gives you monthly updated data on the most important page speed metrics for all the domains you want to track.

You can find all the information you need to set up the dashboard in this Google guide. However, it is important to note that the CrUX Report does not collect data for all domains. For this reason, this method is not suitable for smaller domains with low traffic.
Crawling
Your website should be designed in such a way that it can be crawled by search engine bots with as little resource expenditure as possible. This is particularly important for large websites with a high number of URLs to ensure that all relevant URLs are crawled and indexed.
For this reason, you should always keep an eye on the crawling statistics in Google Search Console. This shows how many resources Google has to use to crawl your site.
The basic goal is to keep the effort as low as possible so that Google & Co. have no reason to reduce the crawl budget. If your website receives an above-average number of crawling requests or you notice a sudden drop in requests, there may be a technical problem or Google may consider your content irrelevant.
You can find the crawl report in Google Search Console under ‘Settings’ > ‘Crawl statistics’. Unfortunately, there is currently no easy way to integrate the report into an external dashboard. We therefore recommend that you regularly access the report directly in GSC.

Keep an eye out for anomalies in the statistics. You should also ensure that as much of the crawling resources as possible are used for HTML files.
Indexing
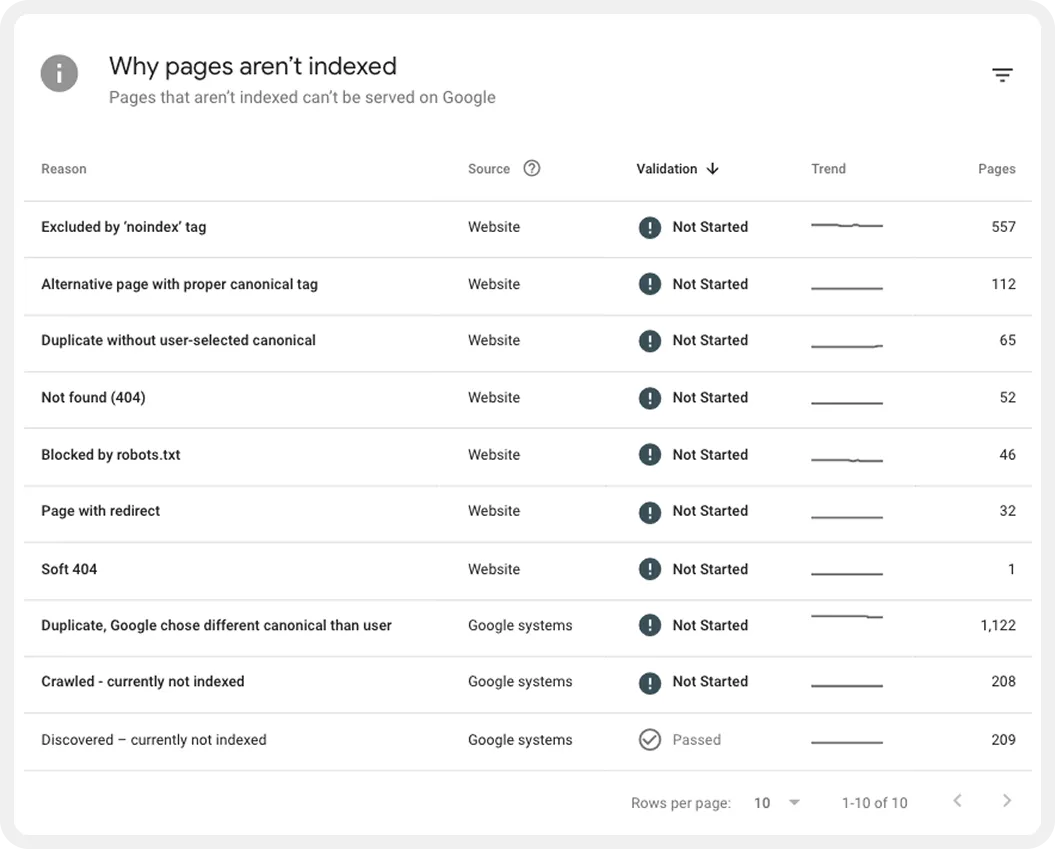
Just because your pages are crawled does not automatically mean that they are also indexed. To ensure that all relevant pages of your domain are included in the Google index, you should regularly check the indexing report in Google Search Console.
Pay particular attention to the error report to identify and fix any problems. The goal should be to ensure that as many indexable URLs as possible are actually indexed.
Monitoring indexing status via the Search Console API
UOur personal tip: For some time now, the indexing report from Google Search Console can also be accessed via the Search Console API. This allows you to integrate the report directly into an external monitoring dashboard. This is particularly useful for relaunch projects, as it provides an overview of the indexing progress
You can find a detailed description of this in this guide by Lazarina Stoy.
[[callout]]
If you are interested, we would be happy to assist you with setting this up.
👉 Simply contact us for a no-obligation introductory meeting.
[[callout end]]
Additional technical metrics
In addition to page load time, crawling, and indexing, there are of course numerous other technical metrics that are crucial for a good technical SEO setup. To ensure that your website is always up to date with the latest developments, it is advisable to measure the most important metrics on an ongoing basis. This allows you to identify errors early on and take appropriate action.
These include factors such as:
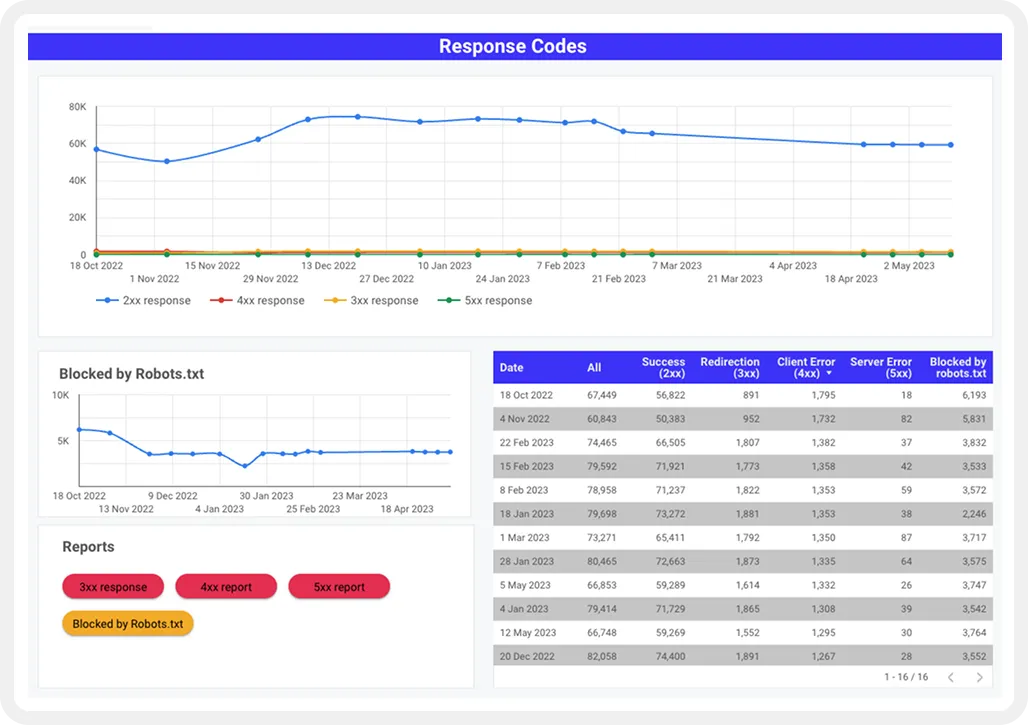
- Internal links to 4xx pages
- Internal links to 3xx pages
- Server errors
- Orphan Pages
- Errors in markup or structured data
- Security factors
You can also integrate these metrics directly into your SEO dashboard so that you always have an overview.
Backlink KPIs
Backlinks remain a key ranking factor for Google when evaluating the relevance and expertise of your website. For this reason, backlink SEO should be an integral part of your strategy. Experience has shown that it is particularly important to focus not only on the quantity but above all on the quality of backlinks. So make sure you get as many high-quality backlinks as possible from websites related to your topic.
To measure your website's performance in terms of backlinks, we recommend the following metrics:
- Number of referring domains
- Number of lost backlinks
- Anzahl der Broken Backlinks
- Number of broken backlinks Positive mentions on other websites
As an overall KPI for backlink performance, we recommend Ahrefs' DR (Domain Rating). This is a metric that represents the strength of your backlink profile on a logarithmic scale from 0 to 100. However, it is important to note that DR is only an estimate and not an official metric from Google. Therefore, domain rating should not be considered the sole indicator of the quality of your backlink profile.
You can measure backlink performance with various tools such as Ahrefs, Moz Open Site Explorer, or Majestics. Many of these tools also offer a connection to Looker Studio so that you can pull the data directly into your dashboard.
{{blog-cta}}
Content SEO KPIs
Content is the heart of your website, as it contributes significantly to generating value for users.
Good content builds trust and signals expertise to visitors and search engines. Content is also one of the most important factors search engines use to decide where a page ranks for a particular keyword. That's why it's crucial to set KPIs for content performance.
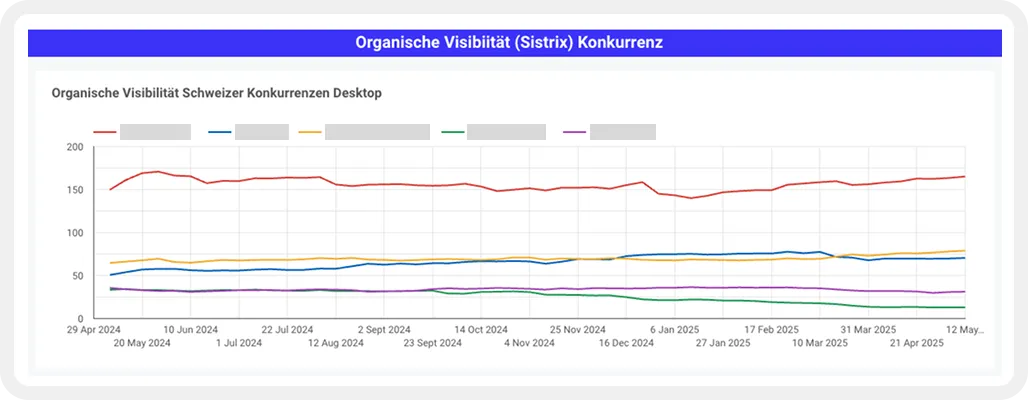
Organic Visibility
The visibility index is a key metric for making an initial assessment of a website's organic visibility. Put simply, the index provides information about the number of keywords for which a website ranks. This allows initial assumptions to be made about how a website performs in comparison to its competitors and how certain algorithm updates affect a website's performance.
However, the visibility index should always be treated with caution, as it is only an initial approximation of actual performance. To make a definitive statement, visibility should always be compared with traffic metrics such as organic clicks or sessions.
Various tools are available to measure the visibility index, such as SEMrush, Searchmetrics, or Sistrix. Many of these can also be linked directly to Looker Studio. For our dashboards, we primarily use data from Sistrix, which we display in personalized Looker Studio dashboards.
Keyword Rankings
In addition to the visibility index, it is always worth tracking the development of keyword rankings for specific, business-relevant keywords. Your website's ranking for important keywords is a significant SEO KPI, as it provides immediate insight into the success of your SEO measures.
Our experience has shown that when tracking keywords, it is always important to consider long-tail keyword variations. Even if the search volumes for the individual variations are often low, the accumulation of different long-tail keywords often results in great potential. So just because you don't rank for the defined main keyword doesn't automatically mean that your site's organic visibility is generally poor.
There are various tools available to measure the performance of keywords. These include Ahrefs, SEMrush, Searchmetrics, Getstat, and Sistrix.
For our customer projects, we mainly use Sistrix and Google Search Console. The data can be easily integrated into a Looker Studio dashboard and displayed clearly.
Organic Click-Through-Rate (CTR)
The click-through rate (CTR) is the ratio between organic impressions and clicks. Basically, it provides information about the attractiveness of your search result. Even the best ranking is of little use if users prefer other results and do not click on your snippet.
In addition to attractive metadata, the composition of the Google SERP also has a decisive influence on the CTR of your keywords. For example, it may be the case that the organic position 1 is only listed after 4 ads and a local pack. In this case, the chances of a good CTR are of course considerably smaller than for a result without ads and other Google snippets. To increase the number of organic clicks, you should therefore analyse and optimise not only the keyword rankings but also the CTR.
You can measure CTR using Google Search Console. To identify keywords with potential for improvement, it is worth focusing on relevant keywords with good rankings and low CTR. In addition, you should make sure that you limit the ‘country targeting’ to a specific country. Otherwise, the evaluation will be distorted.
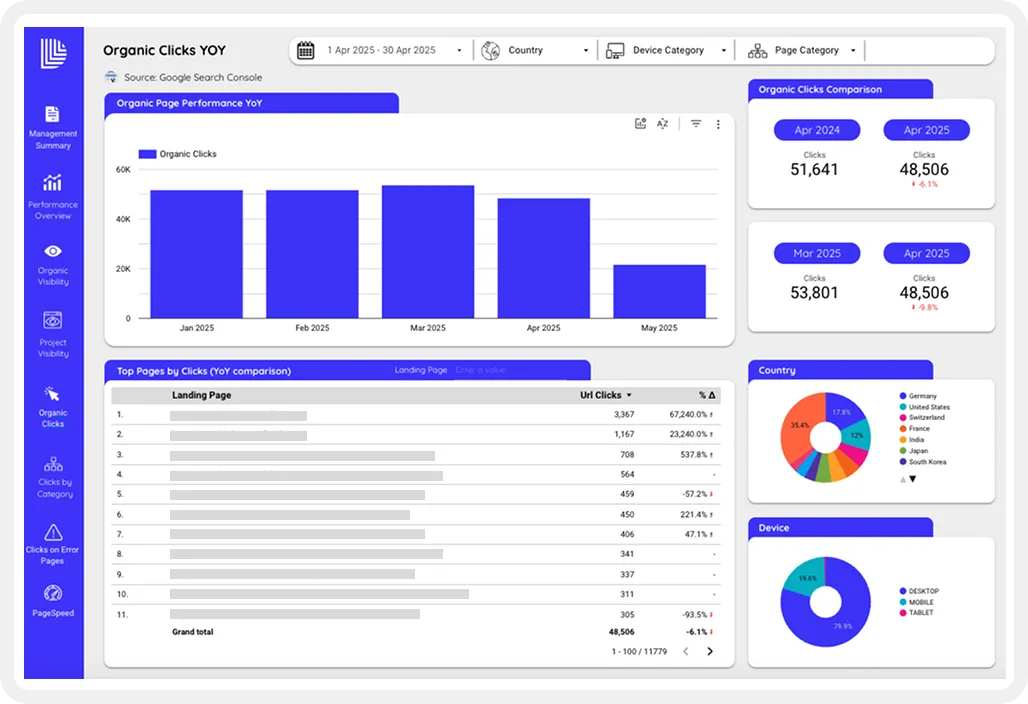
Organic Traffic (Clicks)
This KPI indicates how many users arrive at the website via organic search results. For many website operators, this is the most important metric, as it provides direct information about SEO performance.
The most common tools for measuring organic traffic/clicks are Google Analytics and Google Search Console. Google Search Console is a particularly useful tool, as it allows you to measure not only which URLs users are arriving at the website via, but also which keywords. This allows you to draw direct conclusions about which keywords and keyword clusters work best.
The data from Google Search Console and Google Analytics can be easily imported into a Looker Studio dashboard via the corresponding interfaces. This allows you to monitor the development of the entire site or specific areas of the site and compare them over different time periods.
User Experience KPIs
User experience is becoming increasingly important for search engine optimisation, as it is a key indicator of a website's quality. Search engines take U-factors into account when evaluating the relevance and quality of a website to ensure that they offer users the best possible experience. That's why it's important for you to keep an eye on the most important UX factors.
Google Analytics is a good and simple tool for measuring user engagement data. It includes a range of standard metrics that you can use to measure user engagement. Some prominent examples are:
- Bounce Rate
- Dwell Time
- Scroll Depth
- Pages per Session
- Exit Pages
Especially when combined with other dimensions such as acquisition channel, device type, country or demographic criteria, these metrics can provide a lot of insight into the user-friendliness of your site.
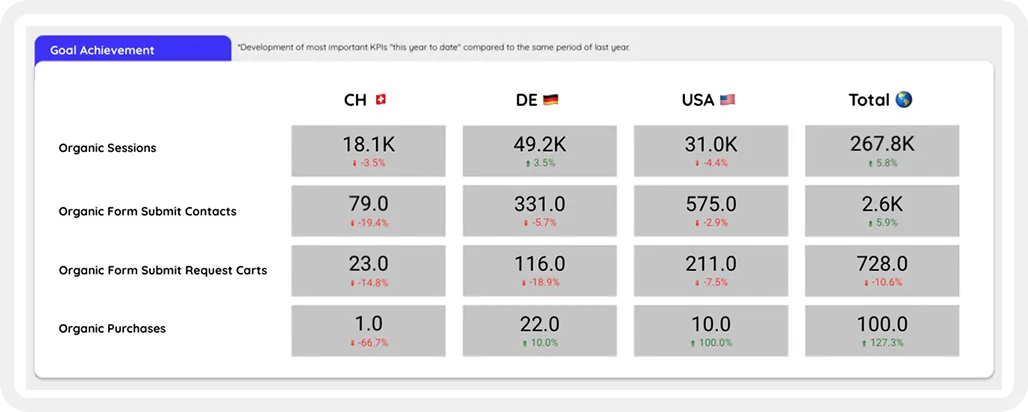
Organic Conversion Rate
The most important metric from a business perspective is probably the organic conversion rate. This figure provides information about the extent to which the organic channel contributes to your business goals.
After all, even the best technical setup and the most appealing content are of little use if your users do not become customers. It is therefore essential that you consider which user actions represent the highest value for you and define these as conversions. This will help you to better understand the value of your traffic and define optimisation measures if the desired goals are not achieved.
The conversion rate is therefore the ratio between the total number of users and the users who have performed a specific, business-relevant action.
To keep track of conversions, we also recommend integrating these metrics directly into your dashboard.
[[callout]]
👉 We are also happy to assist you with the design and implementation.
[[callout end]]
Conclusion
Now you have a good overview of the most important SEO KPIs and can start designing your personal SEO reporting.
To avoid getting lost in the flood of tools and data, you should make sure to focus on metrics that are actually relevant to your business case. For this reason, you should start with a brainstorming session in which you define the most important KPIs along the content marketing funnel. Think carefully about which metrics you can use to measure performance at the different stages of the funnel and limit yourself to the most meaningful KPIs.
Before you dive into the work, here are the most important steps to keep in mind:
- List your business goals.
- Define the most important SEO KPIs based on your goals.
- Map the KPIs along the stages of the content marketing funnel.
- Set up custom events and conversions.
- Design and create the dashboard.
When designing larger SEO reports, it's best to seek professional help from experts. They will help you with the targeted design and implementation of your personalised SEO analytics setup to ensure that you focus on the most important KPIs.